Plains and urban areas
As water flows across the Canterbury/Waitaha Plains and through urban environments, some of the water is abstracted and used for drinking water, primary production, industry and other purposes. These uses affect water quantity and quality both above and below ground.

Issue: Water quantity
After rivers leave the mountains, they flow across the plains towards the coast. Some of the river water seeps into the ground helping to replenish groundwater aquifers beneath the plains. Aquifers also receive additional recharge from rainfall on the plains.
In places, groundwater re-emerges as springs, feeding streams and wetlands that carry the water to the coast.
Monitoring shows that groundwater levels, and flows in rivers and streams on the plains have been affected by abstraction. Reduced river and stream flows impact on aquatic ecosystems.

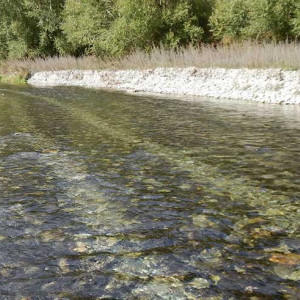
Waitaha Plains aerial view
Abstraction effects
Water abstraction from rivers and groundwater can significantly reduce river flows. Land use intensification and land use change are causing increased demand for water in Waitaha. This is causing low flows to last longer and a reduction in high flows.
Figures 1 (Surface water allocation 1990-2022) and 2 (Groundwater allocation 1990-2022) show how consented allocation has changed over time.
In many areas, surface water and groundwater are now fully allocated or even over-allocated. This means, no more water can be allocated in these areas. However, the full amount of water allocated (consented to be abstracted) is not currently being used, for a range of reasons. These include unbuilt infrastructure, minimum flow restrictions, or consented allocation rates and volumes being higher than what is needed. As a result, there is the potential for even further increases in abstraction and greater impact on flows and groundwater levels, without new consents being issued.
Spring-fed streams and wetlands are particularly susceptible to groundwater abstraction. Effects on streams include reduced flow, increased sediment accumulation and weed growth, as well as poor stream connectivity. Groundwater abstraction can reduce indigenous wetland vegetation and the species it supports.
Figure 1: Surface water allocation increased rapidly between 1990 and 2005. Irrigation accounted for 85 percent of Waitaha water allocated in 2022. Over the last 10 years, total surface water allocation has plateaued in the A block. Since 2008, B and C block water has begun to be granted. A block water is the highest priority and most reliable with the lowest minimum flows. Priority and reliability decrease for B block and further for C block water which are both more targeted at abstraction during higher flows and therefore have higher minimum flows compared to A block.
Figure 2: Groundwater allocation increased rapidly between 1990 and 2010. Irrigation accounted for 85 percent of Waitaha water allocation in 2022. Over the last 10 years, total groundwater allocation has plateaued.

Spray irrigation
Changes in irrigation practices
Changes to irrigation practices have resulted in more efficient use of water, which means less water is being required per hectare for crop and pasture irrigation. This efficiency has sometimes led to a decrease in the amount of water abstracted from rivers. However, it has also led to less recharge to groundwater, lower groundwater levels, decreased flows in spring-fed streams and higher concentrations of nitrate in groundwater.
In areas where newer irrigation schemes have been developed - including Central Plains and Waimakariri - groundwater levels are higher than they were in the recent past due to a combination of less groundwater pumping and extra recharge from the irrigation scheme.
Observed changes in river and stream flows
Most of our rivers and streams are impacted by abstraction, where water is taken directly from rivers, or indirectly, through groundwater abstraction. These impacts occur more frequently in the lower catchment, near the coast (See Figure 3).
Our monitoring finds more frequent and prolonged periods of low flow, as well as an increase in the extent and duration of dry reaches and the loss of surface flow connection to the sea.
Both the magnitude and duration of low flows is important for ecosystem health.
Figure 3: Mean annual low flows MALF(7d) and low flow duration
- This is an interactive map that allows you to search for a site or river type and see how the flow regime has been impacted over time.
- Mean annual low flow MALF(7d) describes how low the flow gets in a typical year. The lowest seven days of flow for each water year is averaged to give the annual low flow (ALF(7d)). These ALF(7d)'s are then averaged across the period of record to give the MALF(7d).
- The duration below MALF(7d) can also be selected.
- White circles indicate sites that were not included because they have short records or were unable to be naturalised.
Figure 4 (Annual lows flows in Selwyn River at Coes Ford) shows the variability of the annual low flow in the Selwyn River/Waikirikiri at Coes Ford. The pale blue dots are the measured flows, while the dark blue dots are our estimate of the natural flow after we have added back surface water takes and stream-depleting groundwater takes.
The plot suggests that even natural flows can be very low in dry years (for example, 2006 and 2017 were at the end of very dry periods), but the cumulative abstraction in the catchment causes them to be even lower in the lower part of the catchment.
Figure 4: Annual low flows in the Selwyn River/Waikirikiri at Coes Ford suggest that cumulative abstraction (the difference between recorded and naturalised flows) in the catchment is driving a trend in lower flows in the lower part of the catchment. Naturalised flow is flow that has had abstractions added back to the recorded flow to create a record of the flow in its natural state. Please note: the gap in data indicates a year with insufficient data to calculate annual low flow.
Likely naturalised annual low flow trend
Analysis of trends in the annual low flows show that low flows are getting lower at many of the sites where we measure flow. Many of the catchments with decreasing trends are in the lower catchments and occur at sites where the flows are being influenced by upstream abstraction. (See Figure 5 Annual low flow trends)
Figure 5: Annual low flow trends
- This is an interactive map that allows you to search for a site or river type and see how the flow regime has been impacted over time.
- The pie graph dots on the map represent likely trends at each monitored river site. Trends have been calculated in increasing five-year intervals to demonstrate the effect of varying time periods. You can select a trend period to see how the likely annual low flow trends for a given site.
- Mean annual low flow MALF(7d) describes how low the flow gets in a typical year. The lowest seven days of flow for each water year is averaged to give the annual low flow (ALF). These ALF's are then averaged across the period of record to give the MALF(7d).
- White circles indicate sites that were not included because they have short records or were unable to be naturalised.
Observed changes in groundwater levels
Groundwater levels rise and fall throughout the year, primarily in response to the weather. They rise during periods of high rainfall, especially in the winter, and they fall over dry summer periods.
On top of these seasonal changes, our monitoring data shows a longer-term trend - the low levels we see in summer are getting lower. Figure 6 shows an example of this using our monitoring data from a well in West Melton. The graph shows a good correlation between groundwater levels and rainfall in the earlier years, but in recent years, there is a mismatch. The rainfall alone cannot account for the summer lows.
Figure 6: Click on the graph to see when major weather events occurred.

The reason for the difference is groundwater abstraction during the summer irrigation season. This is a similar picture to that shown above for flows in the Selwyn River/Waikirikiri at Coes Ford. The increase in groundwater allocation and abstraction since the 1980s has been causing low groundwater levels to become lower over time, leading to lower summer flows in spring-fed streams and shallow wells going dry in some years.
Groundwater levels do recover after a wet winter. For the most part, we are not seeing a long-term depletion of the groundwater resource. For example, groundwater levels were very low in May 2021, but they rose to very high levels by August 2022, after two wet winters in 2021 and 2022 (See Figure 7 below)
Figure 7: State of groundwater for May 2021 (dry period) compared to August 2022 (wet)
Use the slider to see the difference in groundwater levels
Groundwater levels
Very low
Low
Average
High
Very high
Data not recorded
In some areas where groundwater is not quickly replenished, there is long-term water level decline. This decline is most evident in deeper aquifers in mid-plain areas like Ashburton or in aquifers with very old groundwater like Waipara and south of Timaru.
Drinking water
Having access to enough water for domestic use - including drinking water - is essential for healthy communities. On the Waitaha Plains, many individual properties source their domestic water supplies from shallow wells. When groundwater levels are low, wells can go dry or struggle to pump water, impacting on domestic water supply.
Household water is often from a reticulated supply in urban areas and individual supply or small supply schemes in rural areas. Household water may be sourced from either surface water or groundwater, with a small number of properties collecting rainwater for domestic use. At times when anticipated use is high, municipal water supplies can be put on restriction when demand could exceed infrastructure capability or where environmental limits, such as minimum flows, are being exceeded.
In areas with limited access to shallow groundwater such as hill areas, individuals will often need to get their domestic water from nearby springs, streams and rivers. In areas with small streams, such as Banks Peninsula/Horomaka, these small takes can have a significant impact on flows. This in turn impacts on in-stream values and the ability of other downstream users to access domestic water supplies.
Climate change will likely result in increased temperatures and more variable rainfall in Waitaha, leading to changes in river flows and groundwater levels. These factors may impede the ability to access domestic water supply with current well depths and surface water sources.

Growing crops or pasture require irrigation
Water quantity for commerce
Many agricultural and horticultural activities occurring in Waitaha require access to water, usually for growing crops or pasture.
Irrigation makes up 85 percent of consented water use in Waitaha. Most irrigation water is sourced directly from rivers or from groundwater. Minimum flows mean water takes must stop when river flows drop below the minimum flow limit. Allocation limits are the maximum amount of water that may be abstracted. When setting minimum flows or new allocation limits, the needs of the environment, are considered.
Both the minimum flow conditions and allocation limits determine how much water can be abstracted, and when.
Water is often stored in a pond or dam to ensure users have access to water when they need it. This includes when minimum flow restrictions are in place or allocation limits have been reached.
Climate change projections for Waitaha indicate that temperatures are likely to increase, leading to greater demand for irrigation water, and rainfall is likely to become more variable, leading to changes in river flows and groundwater recharge. These factors are likely to decrease water availability.
Current actions or approach
How we manage water quantity
We have set minimum flows (when takes must stop) and allocation limits (a maximum amount of water that can be taken) in many catchments across Waitaha to manage the effects of abstraction.
The impact of minimum flow restrictions vary from year to year. For the 2019-20 water year for example, daily mean flow dropped below the minimum flow at Middle Creek (just north of Kaikōura) over much of the summer (Figure 8 below), meaning water restrictions applied at the time of highest demand.
Figure 8: For the 2019-20 water year, daily mean flow dropped below the minimum flow at Middle Creek (just north of Kaikōura) over much of the summer, meaning water restrictions would have applied at the time of highest demand.
Despite this, ecosystems in many of our regions freshwater environments are under stress. Many rivers and coastal estuary and lagoon ecosystems are also showing signs of stress due to habitat loss, reduced connectivity for fish migration and decline in water quality.
Some of the water quantity limits set in past planning and consent processes have not been adequate to protect ecosystem health.
In many instances where water quantity plan limits have been reviewed and updated to provide better support for healthy ecosystems, resource consents are still in place allowing water abstraction beyond those limits.
The Resource Management Act (RMA) does not allow these consents to be cancelled. However, in some parts of Waitaha, these have been reviewed. An example of this is the Ashburton Consent Review, which brought many consented water takes in line with new minimum flow regimes.

Issue: Water quality
Many decades of land use intensification in Waitaha have contaminated the region's water with nutrients, faecal pathogens, fine sediments and toxic chemicals.
This has degraded the health of aquatic ecosystems in many waterways.
It also affects the suitability of the water for drinking, mahinga kai and recreation activities.

Increasing groundwater nitrate-nitrogen concentrations are found mostly in areas of intensive cropping and livestock farming
Nutrients
Nitrate and nitrogen
Plants require nitrogen to grow. However, excess nitrogen in the environment can impact habitat as it encourages weed and algae growth. At very high concentrations, it can be toxic to animal species.
An increase in irrigation and nitrogen fertiliser use has supported greater numbers of livestock and boosted farm production. But increased inputs of nitrogen, especially from fertiliser and urine has also led to excess nitrogen entering water. Dairy shed effluent, human wastewater and industrial wastewater are other sources of nitrate contamination.
High and increasing groundwater nitrate-nitrogen concentrations are found mostly in areas of intensive cropping and livestock farming on gravelly soils – notably on the Canterbury/Waitaha Plains, the Waitaki River fan and in the Fairlie and Culverden basins (see Figure 1 Nitrate in groundwater in Waitaha).
Nitrate-contaminated groundwater often seeps into surface waterbodies, particularly in the lowland spring-fed streams and lower reaches of hill-fed and alpine rivers. Nitrate-nitrogen concentrations in surface water vary considerably, with highest concentrations occurring in reaches where nitrate-rich groundwater inputs occur.
Some 21 per cent of monitored river sites in Waitaha do not meet the national bottom line of 2.4 mg nitrate + nitrate nitrogen per litre for nitrate toxicity to aquatic species. These sites are on the spring-fed streams of lower basins and plains, and lower reaches of hill-fed rivers.
Records show nitrate-nitrogen concentrations exceeding the Maximum Acceptable Value (MAV) for human drinking water of 11.3mg per litre in up to 12 per cent of our long-term groundwater monitoring wells in Waitaha since 2000. (see Figure 1 Nitrate in groundwater in Waitaha and Figure 2 Nitrate-nitrogen trends)
Over the past 10 years, slowing farm intensification, farming land-use restrictions and good farm management have all helped slow increasing trends. However, nitrate nitrogen concentrations are still increasing in many areas.
Figure 1: Nitrate nitrogen concentration in groundwater in wells in Waitaha
Figure 2: Nitrate trends in Waitaha 1992 - 2022
Phosphorus
Across the Waitaha Plains, 36 per cent of our river monitoring sites have a concentration of dissolved reactive phosphorus that is likely to have a moderate or high impact on ecosystem health. See Figure 3 Dissolved reactive phosphorus (DRP) in rivers and streams in Waitaha:
Figure 3: Dissolved reactive phosphorus (DRP) in rivers and streams in Waitaha
Sedimentation
Many freshwater bodies in Waitaha are naturally stony or gravel-bottomed. This provides for plants, algae and aquatic organisms live, feed and breed.
When fine sediment enters waterways, it settles in areas of low flow and smothers some of these environments and the habitats they support.
The accumulation of fine sediment can reduce oxygen and release other contaminants, which can make the habitat unsuitable for aquatic species.
Fine sediment can also increase the availability of phosphorus, which promotes the growth of nuisance plants and algae, which then further trap and increase the deposition of fine sediment.
Over 50 percent of monitored spring-fed streams do not meet the national limits for ecosystem health. (See Figure 4)
Figure 4: Quantitative Macroinvertebrate Community Index (QMCI)

Leaky wastewater infrastructure and pets are the most likely diffuse sources of E. coli
Pathogens
Pathogens including bacteria, viruses and protozoa are likely to be found in water wherever people and animals are present. Pathogens can pose a health risk to the humans and animals that ingest them through untreated drinking water supplies, contact recreation (like swimming and paddling), or by consuming animals or plants contaminated by them (like shellfish).
There are many pathogens present in human and animal effluent. Their presence in aquatic environments is typically assessed by the amount of faecal indicator bacteria in water. Specifically, the concentration of E. coli (freshwaters), enterococci (marine waters) and faecal coliforms in water indicate the likely risk of disease-causing pathogens being present.
The 2016 Havelock North outbreak was the result of large-scale pathogen contamination of a drinking water supply caused by faecal contamination from grazing animals.
In urban areas, leaky wastewater infrastructure and pets are the most likely diffuse sources of E. coli. Wastewater treatment plants and the disposal points for the treated effluent are the biggest point sources.
We detect faecal contamination (indicated by E. coli) in about 5 to 15 per cent of the wells we monitor each year (See Figure 5 Frequency of E. coli detection in groundwater samples of regularly monitored wells 2017-2022:)
Figure 5: Frequency of E. coli state detection in groundwater samples 2002-2022
From 2017 - 2022, 55 per cent of the rivers and streams we monitored for water quality were considered unsuitable for recreational contact (See Figure 6 Monitoring E.coli in rivers and streams in Waitaha). The figures shows higher E.coli concentrations in the lower reaches of rivers and streams.
Figure 6: Monitoring E. coli in rivers and streams in Waitaha
In townships without reticulation, on-site human wastewater disposal can be a significant source of E. coli to groundwater. Birds and dogs can also introduce E. coli through stormwater or directly into waterways in both urban and rural areas.
Figure 7: Highlights the proportion of summertime monitoring sites that are suitable for contact recreation based on microbial data (E.coli measurements).
As climate change increases the frequency of high rainfall events, this will likely lead to more frequent pathogenic contamination of groundwater.
Rising sea levels will lead to increases in groundwater levels in coastal areas, reducing the distance between effluent disposal points and groundwater. This could result in the flooding of onsite systems or wastewater treatment plants located near the coast.
Toxic and nuisance growth of plants and algae
Prolonged low flows and high nitrogen and phosphorus concentrations create ideal conditions for nuisance plant and algae growths. Excessive plant and algae growth impact ecosystem health, amenity and recreational values.
Algal blooms can be unsightly, create hazardous slippery conditions, and impact recreational enjoyment.
Cyanobacteria (sometimes called blue-green algae) growing on the beds or rivers or in the water column of lakes can cause skin irritation, respiratory problems, and stomach upsets, and can be transmitted through contact and ingestion. They also cause water or food gathered from the water to taste or smell offensive. Drinking water supplies sourced from surface water can be vulnerable to impacts of cyanobacterial blooms.
Animal illness and death through ingestion of cyanobacteria in rivers and lakes are often reported throughout Waitaha. Over the past two decades, more than 100 dog deaths in New Zealand/Aotearoa have been attributed to cyanobacterial growths in rivers.
Each summer we publish health warnings for recreation areas in rivers in Waitaha where cyanobacteria is detected at levels that pose a human health risk. Hill-fed rivers including the Waihao, Opihi, Selwyn/Waikirikiri, and Ashley/Rakahuri commonly have health warnings, but some sites on our alpine rivers and spring-fed streams are also prone to cyanobacterial blooms.
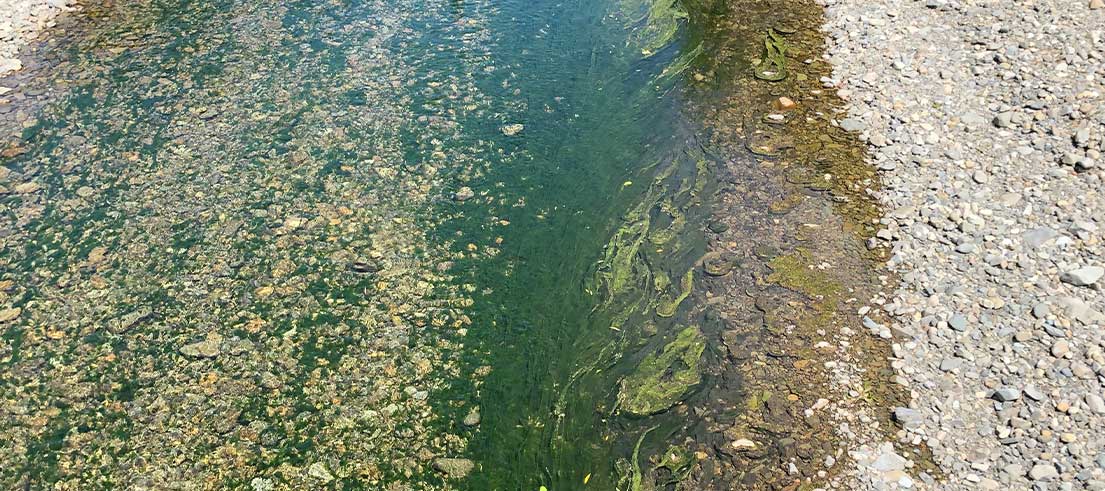
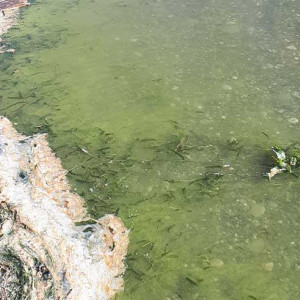
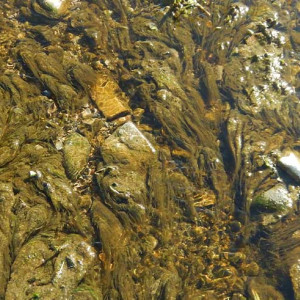
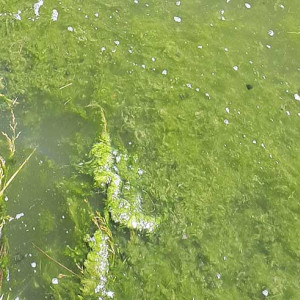
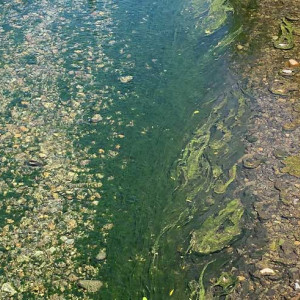
Examples of algae and cyanobacteria blooms
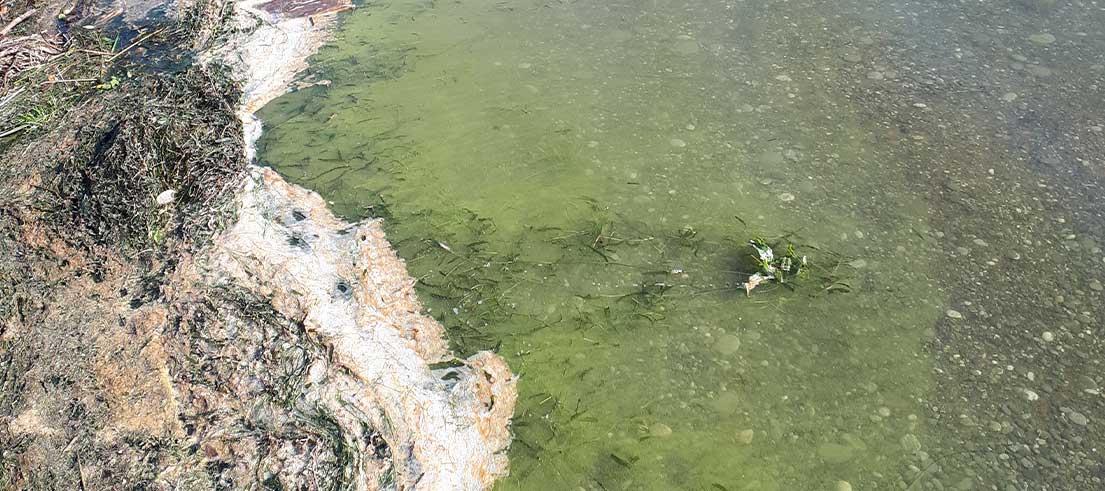
Algae bloom in Lake Forsyth
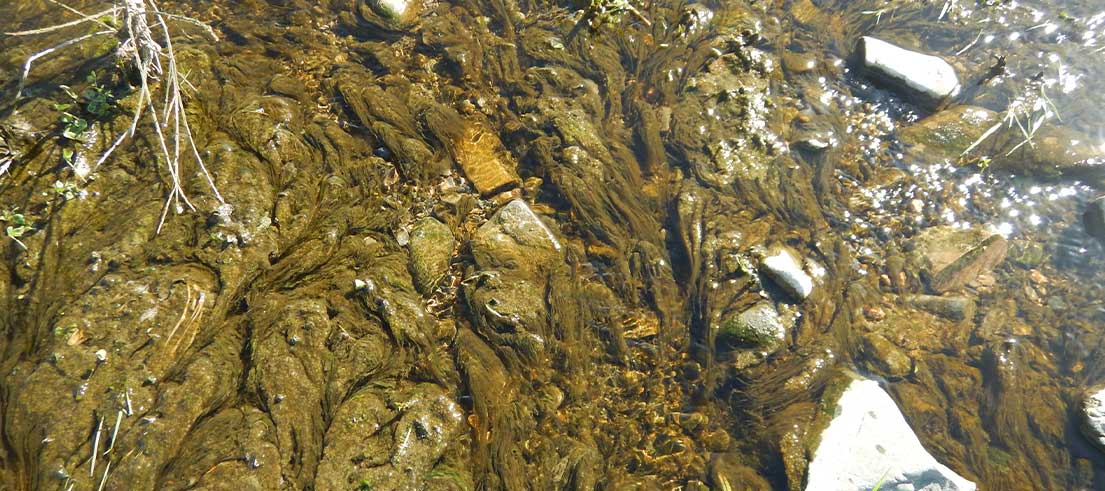
Algae bloom in Elephant stream
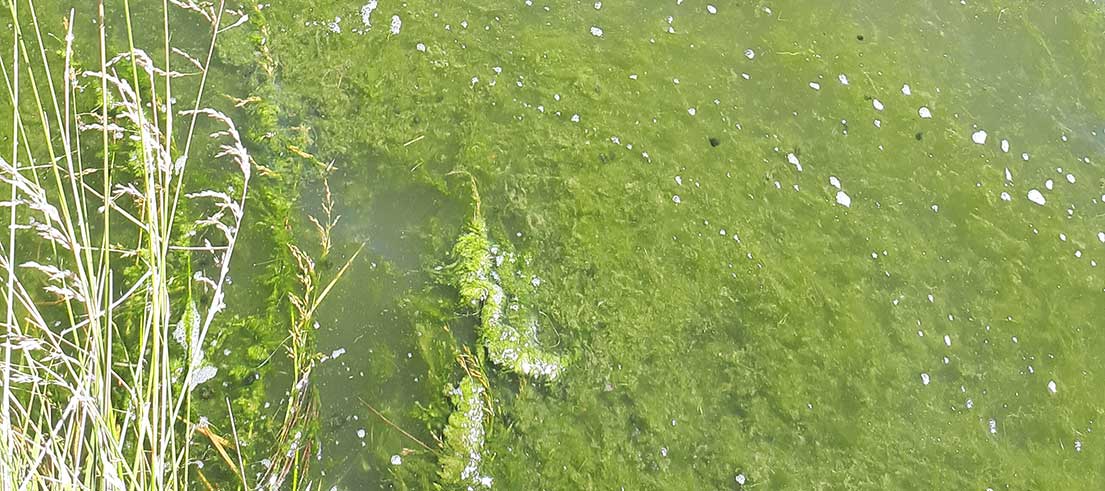
Algae bloom in Muriwai/Coopers Lagoon
Benthic (river bed) cyanobacterial bloom in the Opihi River (March 2017)
Filamentous algae in the Waihi River
Degraded ecosystems
Water quality is a significant driver of aquatic ecosystem health, along with others such as water flow and levels, climate and habitat changes.
Measures of ecosystem health including Quantitative Macroinvertebrate Community Index (QMCI) are useful indicators. Ecosystem health indicators often show our urban rivers and spring-fed streams on the plains to be in the poorest state of health.
Stormwater and industrial contaminants, like metals and sediment along with habitat degradation are key drivers of poor ecosystem health in urban waterways.
Nutrients, sediment, habitat and flow alteration contribute to poor ecosystem health of spring-fed streams on the plains. Fifty per cent of monitored spring-fed plains streams failed to meet the National Policy Statement for Freshwater Management (NPSFM) national bottom line for QMCI attribute state in 2022 (see Figure 8).

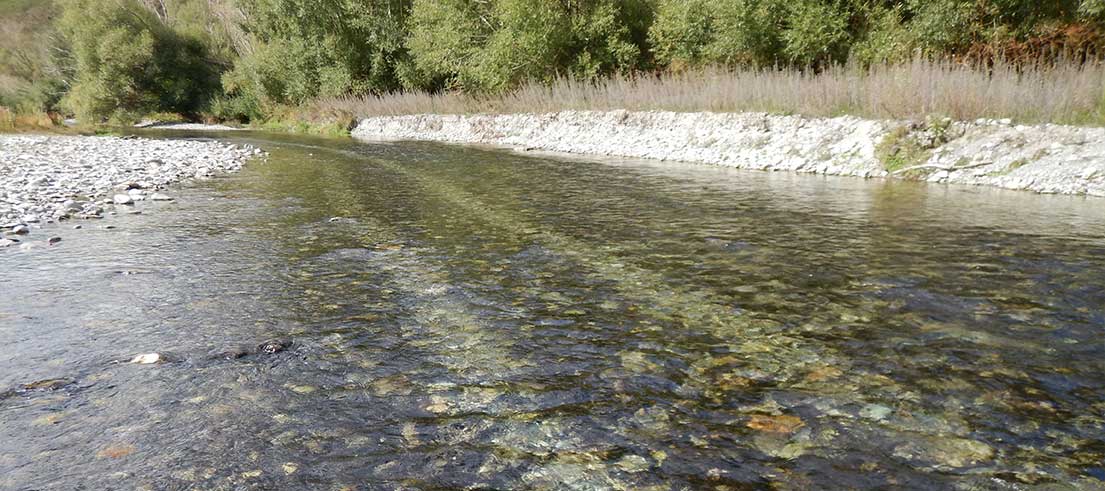
Kowhai River, Kaikōura
Figure 8: Quantitative Macroinvertebrate Community Index (QMCI) in monitored rivers in Waitaha
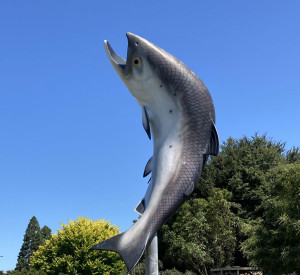
Fishing based tourism in Waitaha
Effects of degraded water quality on regional economy
Declining water quality can impact industries like aquaculture, where elevated nitrate levels can severely impact hatcheries.
Natural values associated with indigenous biodiversity, landscape and features are the basis of the region's tourism industry, and therefore any decline in these values could have impacts on the local economy.
For example, fishing-based tourism in Waitaha relies on water quality sufficient to maintain the populations of prized sports fish.
Current actions or approach
How we manage effects on water from agriculture
The existing management framework focuses on minimising further intensification and getting existing farms to operate according to good management practices (GMP). GMPs can manage water quality effects by minimising nitrogen, phosphorus, sediment and faecal contaminants reaching water sources.
These GMPs are applied in practice via Farm Environment Plans, where farms are required to identify characteristics of the farm system, assess the risk factors to water quality associated with their operation, and manage those risks appropriately.
However, in some areas, applying GMPs may not be enough to reduce nutrient concentrations in water and achieve the objectives of the new NPS-FM.
How we manage effects from urban land uses
At present, the management of reticulated stormwater, wastewater and drinking water) is primarily undertaken by city and district councils.
However, these councils still require resource consents for the earthworks, takes and discharges associated with managing these activities. Through this consenting process, we work with councils to set limits and outcomes for water quality.
Central government is currently reforming the way Three Waters is managed. You can see more info on the MfE website.